Spectral Classification of Stars
Astronomers are very interested in spectra – graphs of intensity versus wavelength for an object. They basically tell you how much light is produced at each color. Spectra are described by Kirchoff's Laws:
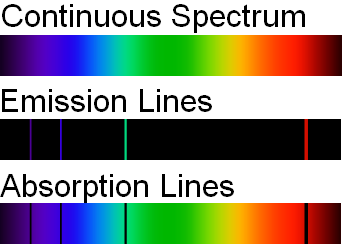
- A hot opaque body, such as a hot, dense gas (or a solid) produces a continuous spectrum – a complete rainbow of colors.
- A hot, transparent gas produces an emission line spectrum – a series of bright spectral lines against a dark background.
- A cool, transparent gas in front of a source of a continous spectrum produces an absorption line spectrum - a series of dark spectral lines among the colors of the continuous spectrum.
It should be noted that the bright lines in the emission spectrum occur at exactly the same wavelengths as the dark lines in the absorption spectrum. Thus, one can think of the absorption spectrum to the right as the continuous spectrum minus the emission spectrum.
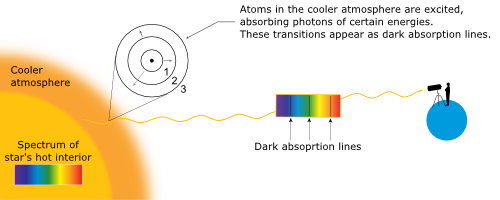
The light that moves outward through the sun is what astronomers call a continuous spectrum since the interior regions of the sun have high density. However, when the light reaches the low density region of the solar atmosphere called the chromosphere, some colors of light are absorbed. This occurs because the chromosphere is cool enough for electrons to be bound to nuclei there. Thus, the colors of light whose energy corresponds to the energy difference between permitted electron energy levels are absorbed (and later reemitted in random directions). Thus, when astronomers take spectra of the sun and other stars they see an absorption spectrum due to the absorption of the chromosphere.
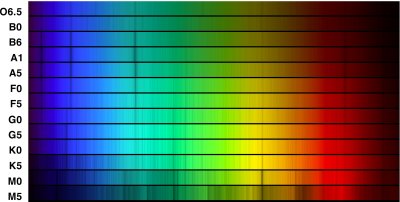
Astronomers have devised a classification scheme which describes the absorption lines of a spectrum. They have seven categories (OBAFGKM) each of which is subdivided into 10 subclasses. Thus, the spectral sequence includes B8, B9, A0, A1, etc. A traditional mnemonic for the sequence is Oh, Be, A Fine Girl/Guy, Kiss Me!
Although based on the absorption lines, spectral type tells you about the surface temperature of the star. One can see that there are few spectral lines in the early spectral types O and B. This reflects the simplicity of atomic structure associated with high temperature. While the later spectral types K and M have a large number of lines indicating the larger number of atomic structures possible at lower temperatures.

Most of the early work on stellar spectra was done early in the 20th century at Harvard University. The principal figure in this story was Annie Jump Cannon. She joined Harvard as an assistant to Observatory Directory Edward C. Pickering in the 1890's to participate in the classification of spectra. She quickly became very proficient at classification examining several hundred stars per hour. She completed a catalogue of spectral types for hundreds of thousands of stars.
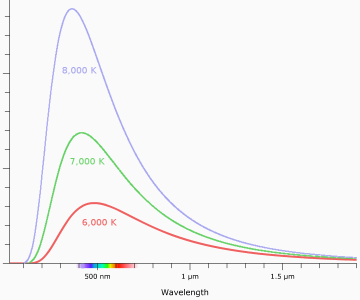
The outward appearance of stars depends more strongly on the underlying continuous spectrum coming from the inner parts of a star than the absorption at its surface. Continuous spectra for stellar interiors at different temperatures are described by Planck Curves shown in the figure to the left. Note that as the temperature increases the total amount of light energy produced (the area under the curve) increases and the peak wavelength (the color at which the most light is produced) moves to smaller more energetic wavelengths.
| Classification | Temperature | Max Wavelength | Color |
|---|---|---|---|
| O0 | 40,000 K | 72.5 nm | Blue |
| B0 | 20,000 K | 145 nm | Light Blue |
| A0 | 10,000 K | 290 nm | White |
| F0 | 7,500 K | 387 nm | Yellow-White |
| G0 | 5,500 K | 527 nm | Yellow |
| K0 | 4,000 K | 725 nm | Orange |
| M0 | 3,000 K | 966 nm | Red |
| This table lists corresponding values of color, spectral type, and peak wavelength. Note that these are all different ways of talking about the surface temperature of a star. | |||
One can experiment with the relationships between spectral type, temperature, and color with the simple animation below. Use the animation to answer the following questions:
What are the surface temperatures and colors of:
- a hot O2 star?
- a cool M3 red dwarf?
- a G2 star like the sun?
What is the spectral type of a star with:
- a surface temperature of 10,000 K ?
- a surface temperature of 5,000 K ?
What is the color of a star with:
- spectral type A0?
- surface temperature 4,000 K?