Spectral Types of Stars
What color is the light reflected from a white sheet of paper? The obvious answer is "white", but what if we passed a beam of the reflected light through a prism? We'd see that the beam actually contains a rainbow of colors.
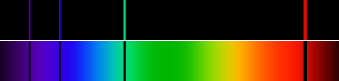
What a prism does is spread light out by wavelength into a spectrum. The shortest wavelengths of visible light – violet – appear at one side of the spectrum and the longest wavelengths – deep red – appear at the other end.
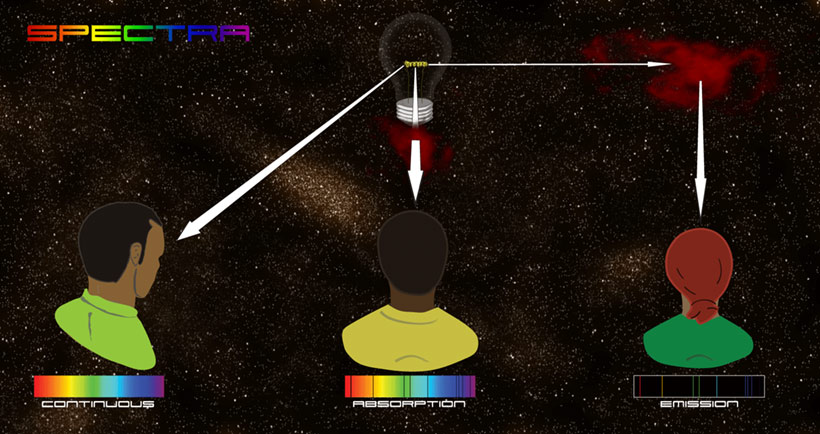
Studying the light from stars and other sources is a central concern in astronomy. There is a lot that can be learned by looking at how much light is detected at each wavelength. Most light sources can be classified into three main types: continuous, absorption, and emission.
A hot, opaque object, like the filament in an incandescent light bulb, emits a continuous spectrum, having light of all wavelengths. A hot, dense gas is another example of an object that emits a continuous spectrum.
If light from a continuous spectrum passes through a cool, transparent gas we observe dark lines appear in the spectrum. The lines occur where atoms of the gas have absorbed specific wavelengths of light. Hence we call this type of spectrum an absorption spectrum.
If we view this transparent gas against a black background we would see that it also emits light (if it has an enough energy), giving an emission spectrum. An emission spectrum looks like the opposite of an absorption spectrum, with emission lines at specific wavelengths. In fact, the wavelengths of the emission lines are the same as the absorption lines (for the same type of gas). These discrete lines are due to the quantum nature of the atom. Florescent lights, neon signs, and many streetlights are examples of emission spectrum sources.
A star is a hot dense ball of gas so we should expect it have a continuous spectrum. But stars also have thin, transparent outer layers that light has to pass through. These layers produce absorption lines. Thus the light from the sun and stars are examples of absorption spectra.
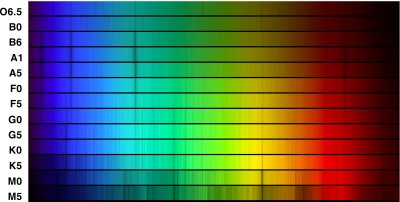
The stars' spectra differ from each other depending on temperature and composition. When astronomers first observed these differences in the 19th century they devised a classification system that assigned letters to various spectral types. (These letters are arbitrary and don't stand for anything.) The system used by astronomers today has seven categories, each of which is associated with a temperature. From hottest to coolest these categories are O, B, A, F, G, K, and M. These categories are each divided into 10 numbered subclasses, so an astronomer might speak of an A7 star or an M3 star. The sun is a G2 star. A traditional mnemonic for the sequence is Oh, Be, A Fine Girl/Guy, Kiss Me!
Although the correlation was not understood at first, a star's spectral type gives an indication of its temperature. The diagram below shows the spectra of stars of each main spectral type. Note that there are few spectral lines in the early spectral types O and B. This reflects the simplicity of atomic structure associated with high temperature. The later spectral types K and M have a large number of lines indicating the larger number of atomic structures possible at lower temperatures.
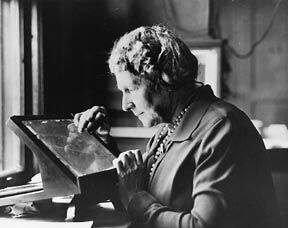
Most of the early work on stellar spectra was done early in the 20th century at Harvard University. The principal figure in this story was Annie Jump Cannon. She joined Harvard as an assistant to Observatory Directory Edward C. Pickering in the 1890's to participate in the classification of spectra. She quickly became very proficient at classification examining several hundred stars per hour. She completed a catalogue of spectral types for hundreds of thousands of stars.
Spectral lines aren't the only thing that changes with temperature. The luminosity of a star increases dramatically with increases in temperature. The star's overall color changes too – cool stars have a reddish color while the hottest stars appear blue.
While continuous spectra have light at all wavelengths the actual brightness or intensity – the amount of energy emitted – at each wavelength is a function of the temperature. For each temperature there is a peak wavelength where the intensity is greatest. As temperature increases this peak shifts to shorter (bluer) wavelengths. Thus the perceived overall color shifts from red to blue with increasing temperature.
The graph below shows the intensity as a function of wavelength for three idealized emitters at 3000 K, 6000 K, and 12000 K. Such an idealized emitter is often called a blackbody source since we assume it absorbs all the light that hits it (it wouldn't necessarily look black though since it also emits energy). We know that stars are not perfect blackbodies since they have absorption lines, but their emission curves are generally similar to a blackbody curves.
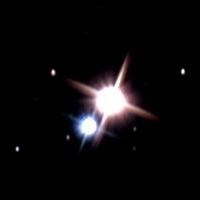
The interactive element at right shows how a star's color is related to spectral type, or temperature. The image is meant to simulate how such a star would appear through a telescope (including the 'diffraction spikes', which are a common artifact in reflecting telescopes). The size of the star changes to indicate its brightness, not its actual size (stars are too small to resolve or see in ordinary telescopes).
The sun is a G2 star with a temperature of 5780 K. So the color of the sun is white with a red tint. But that's the color seen in outer space, on the earth we have to look at the sun through miles of atmosphere. Particles in the atmosphere scatter sunlight, but the amount of scattering depends on the light's wavelength. For the kind of scattering that takes place in the atmosphere, blue light is scattered much more than red light. This causes the sky to look blue, but it also causes the sun to appear more yellow or red, depending on atmospheric conditions. The effect is especially pronounced when the sun is low in the sky and its light has to pass through more of the atmosphere.