Spectra
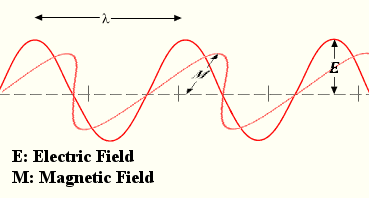
In astronomy light is thought of as a wave of electromagnetic energy. The wavelength (λ) of light is the length of a full oscillation of the wave, such as shown in figure to the right. Wavelength has dimensions of length. The frequency (ƒ) of light is the number of wavelengths that pass a certain point in period of time. Frequency has the dimensions of inverse time.
Light travels very quickly (exactly 299,792,458 m/s in a vacuum and that speed is denoted by the letter c). Wavelength and frequency are related by the speed of light.
Different kinds of light are distinguished by wavelength or frequency (being able to convert from one to the other very easily). A range of frequencies is referred to as a band. For example the spectrum of light some people can see is from about 380 nm to 780 nm and is called the visible or optical band.
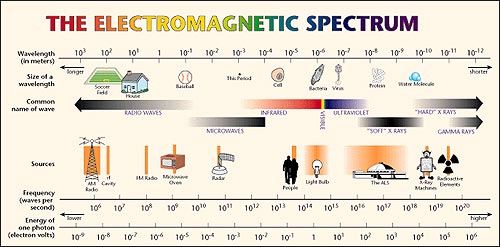
But the full spectrum of light is much larger than the visible band. It includes the very long wavelengths of radio waves to the very short wavelengths of gamma rays. The figure below shows more of the full spectrum of light and where the visible spectrum fits into the full spectrum.
Light coming from a source will not be equal in strength at all wavelengths. Specific intensity (Iƒ) refers to the light power coming from a direction for a particular frequency. The total intensity is the sum of the intensities of all frequencies.
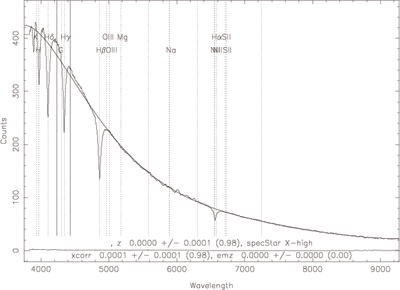
The amount of light that is coming from a star or other source at each frequency is extremely useful to astronomers. A plot of intensity (or some equivalent measure) vs. frequency (or wavelength) is a spectrum. The plot to the right shows a spectrum for a white dwarf star from the Sloan Digital Sky Survey. A large amount of information such as temperature and chemical composition were obtained from it.
Part of the reason a lot of information can be obtained is because chemical compounds don't emit all wavelengths of light. Depending on how the light from the chemical compound is observed, an emission or absorption spectrum will be observed. Below is the emission spectrum of hydrogen. Note how only certain frequencies of light are present.

Blackbody radiation is the light that an object emits based purely on its temperature. While all objects in the universe emit radiation thermally, no true blackbody exists in nature as other factors play into how a body radiates energy. But many objects come close. The remnant thermal radiation from the beginnings of the universe is very close to a blackbody. The light emitted from a dense, solid object is somewhat close. Stars emit something close to a blackbody.
Though a blackbody emits radiation at all frequencies, the intensity at each frequency is different. The intensity vs. frequency relationship of a blackbody is well defined by a complex formula (Iƒ = 2hƒ3/c2 × (e(hƒ/kT)-1)-1). But two useful relationships can be derived from it: the Stefan-Boltzmann law and Wein's law.
The Stefan-Boltzmann law states that the total power per area emitted by a blackbody is proportional to the fourth power of the temperature. That is:
where F is energy per area (known as flux or intensity) and σ = 5.67 × 10⁻⁸ W m-2 K-4 is the Stefan-Boltzmann constant and T is temperature given in Kelvins. Wein's law gives the location of the peak of the blackbody curve – the most intense frequency of light. It is
where T is the temperature in Kelvins
The graph below shows the blackbody curves for three different temperatures. Not how the intensity emitted by higher temperature is much greater as it scales with temperature to the fourth power. The vertical scale slider will need to be used to see the lower temperature curves.