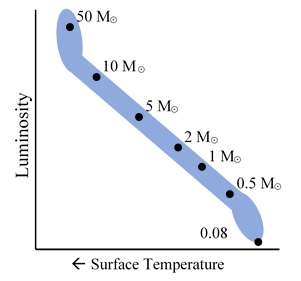

Most of the stars on the HR Diagram are found in a diagonal region known as the main sequence – these stars are fusing Hydrogen to Helium in their cores.
We can describe the mass of stars along the main sequence using the mass-luminosity function this is typically given as ...
| |
So the further up or further to the left you move on the main sequence ... the stars get more and more massive. We can then determine from the mass of the main sequence star how long it will live as a main sequence star fusing Hydrogen into Helium.
Just like big cars are often gas guzzlers – massive stars burn through the Hydrogen in their cores much faster than smaller stars.
This idea is depicted in this fun HR Diagram for cars, where we have plotted the power output of cars on the y-axis increasing upward and weight on the x-axis increasing to the left. Most stars fall along a “main sequence” where we get large powerful cars in the upper left and small efficient cars in the lower right, just like for stars. Different cars also have radically different rates of fuel consumption -- Volkswagen Beetles with 34 mpg in the lower right to Hummers with 9 mpg in the upper left.

Note that it may seem a little counter-intuitive that the star with the least mass lives the longest, but it is due to the rate of nuclear reactions. The lowest mass star is like a compact car, it uses its fuel conservatively.